|
If you were asked to plot the function,
y = C · ax,
you would probably sketch it on the linear scale (in the standard xy-plane).
Alternatively, you could plot this function using the logarithmic scale. To do this
you would take the logarithm of both sides
and plot log (y) against x, as shown below
log (y) = log (C · ax) = log (C) + log (ax) = log (C) + x log (a).
What should the plot
of log (y) = log (C) + x log (a) look like?
Suppose we let
|
b = log (C), |
and m = log (a). |
Using these new variables the equation becomes,
Do you know what the graph of this equation looks like? It looks like a line!
Thus, exponential functions, when plotted on the log-linear scale, look like lines
. We call this type of plot log-linear because we are plotting the logarithm of the dependent variable (log (y)) against
the independent variable (x).
Why use the log-linear scale?
Plotting on the log-linear scale is an easy way to determine if a quantity is
growing exponentially because the graph should look like a line. Assuming exponential
growth, the slope of the line, m, is given by the logarithm of the base
of the exponential function, log (a). Suppose you are given some data on a growing
population, and you are asked, “Is the population growing exponentially?”.
Plotting the data on the linear scale should give you a curve; but is that curve
an exponential curve? Your eye alone would have a hard time determining this.
However, if you plot the data on the log-linear scale, your eye can detect if the
data falls in a straight line. A visual inspection of the graph will tell you the following
- If the population is growing exponentially, you will see a straight line.
- If the growth is slower than exponential, the curve will be concave down.
- if the growth is faster than exponential, the curve will be concave up.
|
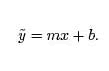
Look at the data
Figures 1 and 2 show two different functions plotted on the linear scale.
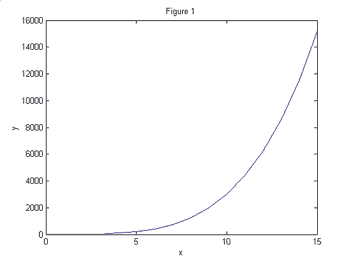 
Suppose
we wanted to know which function demonstrates exponential growth. This is
difficult to determine using only your eye. However, Figures 3 and 4 show these
same two functions plotted on the log-linear scale.
 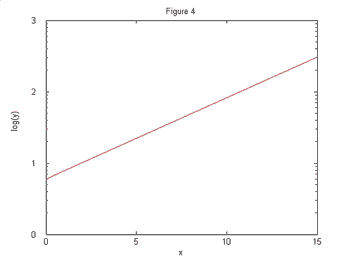
It is now perfectly clear that the function in Figures 2 and 4 grows exponentially
while the function in Figures 1 and 3 grows slower than exponentially since the
curve is concave down.
Using the logarithmic scale to plot data that spans a large range of values.
A plot of data that spans a large range of values can be uninformative. Biologists
are confronted with this problem because they often work with data over several
orders of magnitude. One very large number in a set of data can
mask differences between the other data points. To deal with this problem,
one can take the logarithm of numerical data. We will see why this is convenient
by examining the data presented below
| Haploid genome sizes for various organisms. |
| Organism |
Genome Size (bp) |
| Amoeba dubia |
670,000,000,000 |
| Fritillaria assyriaca |
124,900,000,000 |
| Human |
3,400,000,000 |
| Fruit Fly |
180,000,000 |
| E. coli |
4,639,221 |
| Helicobacter pylori |
1,667,867 |
| Mycoplasma pneumoniae |
816,394 |
| HIV-1 |
9,750 |
| Source: http://www.cbs.dtu.dk/databases/DOGS/ |
As you can see, the genome sizes vary over several orders of magnitude. Plotting this data on a linear scale is not particularly informative

As you can see, the data points corresponding to several of the organisms are
grouped together, and thus indistinguishable from one another because the genome of
Amoeba dubia is much, much larger than all the others. As you can see below, plotting this information on a logarithmic scale unmasks the differences among the
organisms.
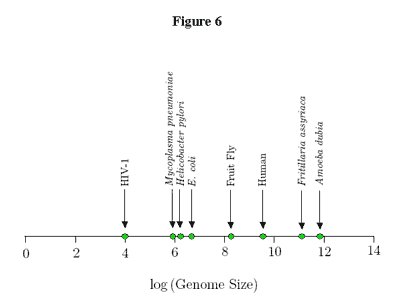
While this type of plot is helpful,
keep in mind that the genome size differences are much larger than they appear
on the log scale.
*****
The next section contains some examples to help you solve equations involving exponentials and logarithms.
Solving Logarithmic Equations
|
