Trigonometric Functions
Graphing Trigonometric Functions
|
In this section we will explore the graphs of the six trigonometric functions, beginning with the graph of the cosine function. Graphing y = cos x We can plot these points and sketch a smooth curve going through them:
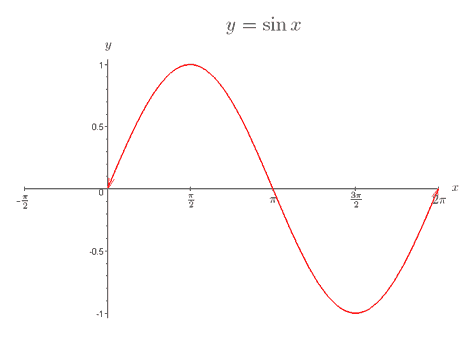
Since the domain of the cosine function is all real numbers, we place arrows on the graph to indicate that the graph repeats itself exactly in both directions. The fact that the cosine function repeats itself means that that it is periodic. In particular, y = cos x is periodic with period 2π . This means that if the point (x, y) lies on the graph, then the point (x+2kπ, y) will also lie on the graph where k is any integer. For example, (x + 2π, y) and (x − 2π, y) will both lie on the graph. Graphing y = sin x To sketch a graph of y = sin x we can make a table of values that we can compute exactly:
We can plot these points and sketch a smooth curve going through them:
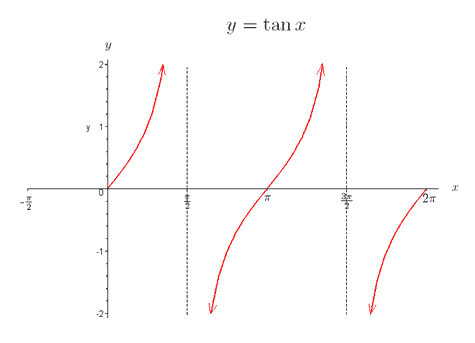
Since the domain of the sine function is all real numbers, we place arrows on the graph to indicate that the graph repeats itself exactly in both directions. Like the cosine function, the sine function is also 2π periodic. Graphing y = tan x To sketch a graph of y = tan x we can make a table of values that we can compute exactly: Notice that we now have some undefined functional values; graphically, these correspond to vertical asymptotes. We can sketch y = tan x as follows:
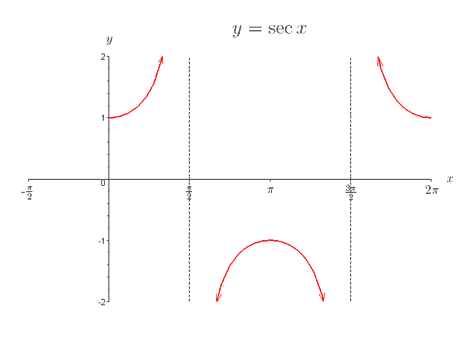
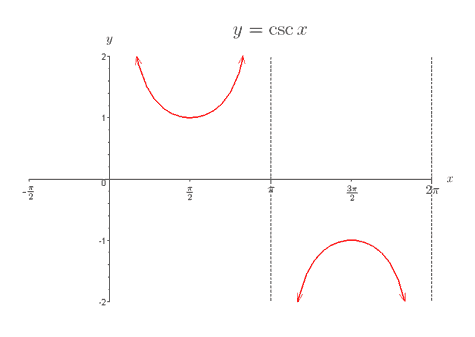
In the above graph, the dashed lines indicate vertical asymptotes. We place arrows on the graph to indicate that the function increases to ∞. For example, tan x → ∞ as x → (π/2)- (i.e. as x approaches π/2 from the left) and tan x → −∞ as x → (π/2)- (i.e. as x approaches π/2 from the right). Unlike the sine and cosine functions, the tangent function is π periodic. That is, if the point (x, y) lies on the graph of y = tan x so will the point (x + kπ , y) where k is any integer. Graphing y = sec x, y = csc x, and y = cot x Recall that the secant, cosecant, and cotangent functions are the reciprocals of the cosine, sine, and tangent functions, respectively. You are less likely to encounter these graphs in your studies of the life sciences. We are including these graphs for completeness.
Transforming y = cos x and y = sin x We will now look at graphical transformations of y = cos x and y = sin x. We can write a transformed cosine and sine function as follows, y = a cos (b(x − d)) + c, y = a sin (b(x − d)) + c. We call |a| the amplitude of the function. The amplitude is the distance from the minimum functional value to the maximal functional value divided by 2. The period of the above functions is 2π/b (notice when b = 1, the period is 2π). When modeling a particular quantity or phenomenon using a sine or cosine function, the amplitude and period are two important features defining the behavior. You can refer to the transformations section to examine the other transformations more closely. ***** In the next section we will present trigonometric identities. |
The Biology Project > Biomath > Trigonometric Functions > Graphing Trigonometric Functions
Department of Biochemistry and Molecular Biophysics
The University of Arizona
April 2006
Contact the Development Team
http://www.biology.arizona.edu All contents copyright © 2006. All rights reserved.


