Polynomial Functions
Graphing Polynomials
|
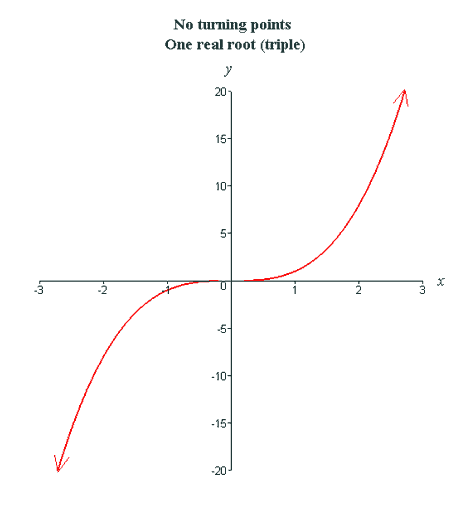
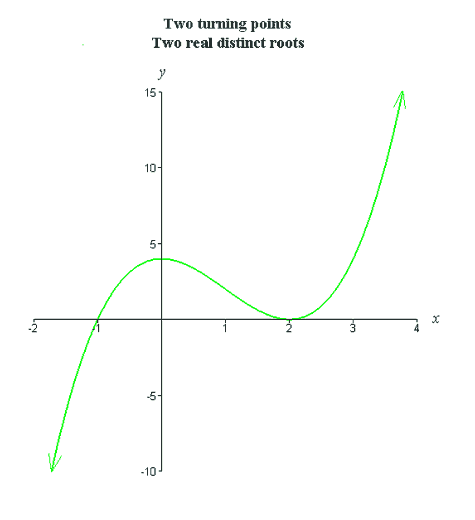
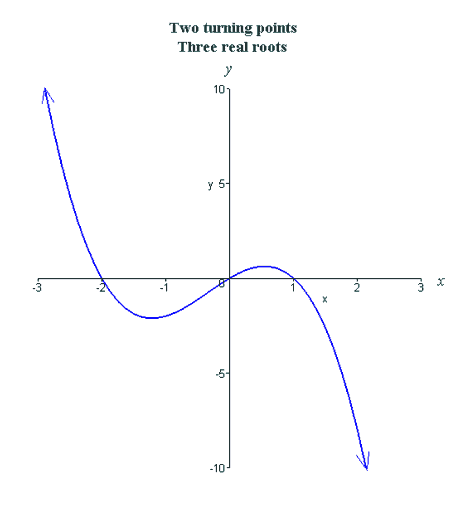
In this section we will explore the graphs of polynomials. We have already discussed the limiting behavior of even and odd degree polynomials with positive and negative leading coefficients. Also recall that an nth degree polynomial can have at most n real roots (including multiplicities) and n−1 turning points. We will explore these ideas by looking at the graphs of various polynomials. Cubic functions can have at most 3 real roots (including multiplicities) and 2 turning points. We will look at the graphs of cubic functions with various combinations of roots and turning points as pictured below.
The multiplicity of a root affects the shape of the graph of a polynomial. Specifically,
As the multiplicity of the root increases, the graph flattens out more and more near the root. In the red graph above, there is one distinct real root, x = 0, having multiplicity 3. Since the multiplicity is odd, the graph does cross the x-axis at the root, but the graph flattens out near this root because the root is not simple. In the green graph above, there are two distinct real roots, x1 = −1 and x2 = 2. Notice that the graph does not cross the x-axis at the root x2 = 2 (it simply touches the x-axis). This indicates that x2 = 2 is a root of even multiplicity (in fact, the multiplicity is 2 because a cubic is only degree 3). Thus, the cubic pictured in green has one simple root, x = −1, and one double root, x = 2 (for a total, including multiplicities, of 3). We can actually take a look at how increasing multiplicity affects the shape of the graph near a root. The figure below shows polynomials with one distinct real root, x = 0. As you can see, the graph touches the root without crossing the x-axis when the multiplicity is even, and crosses the x-axis through the root when the multiplicity is odd. Furthermore, the graph flattens out more and more near the root as the multiplicity increases.
***** Now try some problems that will test your knowledge of polynomial functions. |
The Biology Project > Biomath > Polynomial Functions > Graphing Polynomial Functions
Department of Biochemistry and Molecular Biophysics
The University of Arizona
March 2006
Contact the Development Team
http://www.biology.arizona.edu All contents copyright © 2006. All rights reserved.


