Transformations of Graphs
Vertical Stretches and Shrinks
|
What are Vertical Stretches and Shrinks? While translations move the x and y intercepts of a base graph, stretches and shrinks effectively pull the base graph outward or compress the base graph inward, changing the overall dimensions of the base graph without altering its shape. When a graph is stretched or shrunk vertically, the x -intercepts act as anchors and do not change under the transformation.
Examples of Vertical Stretches and Shrinks Consider the following base functions,
The graphical representation of function (1), f (x), is a parabola. What do you suppose the graph of y1(x) = 1/2f (x) looks like? Using the definition of f (x), we can write y1(x) as, y1 (x) = 1/2f (x) = 1/2 ( x2 - 2) = 1/2 x2 - 1. Based on the definition of vertical shrink, the graph of y1(x) should look like the graph of f (x), vertically shrunk by a factor of 1/2. Take a look at the graphs of f (x) and y1(x).
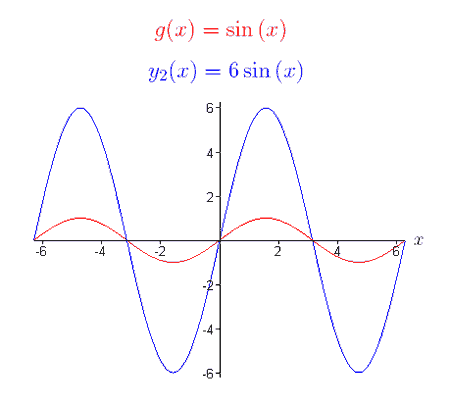
Notice that the x-intercepts have not moved. Function (2), g (x), is a sine function. What would the graph of y2(x) = 6g (x) look like? Using our knowledge of vertical stretches, the graph of y2(x)should look like the base graph g(x) vertically stretched by a factor of 6. To check this, we can write y2(x) as, y2(x) = 6g(x) = 6 sin (x), construct a table of values, and plot the graph of the new function. As you can see, the graph of y2(x) is in fact the base graph g(x) stretched vertically by a factor of 6.
***** In the next section, we will explore horizontal stretches and shrinks. |
The Biology Project > Biomath > Transformations > Vertical Stretches and Shrinks
Department of Biochemistry and Molecular Biophysics
The University of Arizona
January 2006
Contact the Development Team
http://www.biology.arizona.edu
All contents copyright © 2006. All rights reserved.

