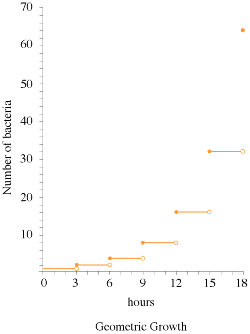
In this section we will return to the questions posed in the first
section on exponential and
logarithmic functions. Recall that we are studying a population of bacteria
undergoing binary fission. In particular, the population doubles every
three hours.
We would like to know the
following:
- How many bacteria are present after 51 hours if a culture is inoculated
with 1 bacterium?
- With how many bacteria should a culture be inoculated if there
are to be 81,920 bacteria present on hour 42?
- How long would it take for an initial population of 6 to reach a size
of 12,288 bacteria?
Animation
of bacterial culture
The population of bacteria in our example doubles every 3 hours. What
exactly does that mean? Imagine you inoculate a fresh culture with N bacteria
at 12:00 pm. At 3 pm, you will have 2N bacteria, at 6 pm you will have
4N bacteria, at 9 pm you will have 8N bacteria, and so on. If these
cell divisions occur at EXACTLY each of these time points the cells are
said to be growing synchronously. If this were the case, the growth process
would be geometric. A
geometric growth model predicts that the population increases at discrete
time points (in this example hours 3, 6, and 9). In other words, there
is not a continuous increase in the population.

However, this is not what actually happens. Returning to our example above,
imagine you take a small sample of the culture every hour and count
the number of bacteria cells present. If bacterial growth were geometric,
you would expect to have N bacteria between 12 pm and
3pm, 2N bacteria between 3 pm and 6 pm, etc. However, if you perform this
experiment in the laboratory, even under the best experimental conditions,
this will not be the case. If you go a step further and make a graph with
the number of bacteria on the y-axis
and time on the
x-axis, you will get a plot that looks much more like exponential
growth than geometric growth.

Why does bacterial growth look like exponential
growth in practice?
The answer is because bacterial growth is not completely synchronized.
Some cells divide in fewer than 3 hours; while others will take a little
longer to divide. Even if you start a culture with a single cell, synchronicity
will be maintained only through a few cell divisions. A single cell will
divide at a discrete point in time, and the resulting 2 cells will divide
at ABOUT the same time, and the resulting 4 will again divide at ABOUT
the same time. As the population grows, the individual nature of cells
will result in a smoothing of the division process. This smoothing yields
an exponential growth curve, and allows us to use exponential functions
to make calculations that predict bacterial growth. So, while exponential
growth might not be the perfect model of bacterial growth by binary fission,
it is the appropriate model to use given experimental reality.

